Stability tests of scour protection layers of a gravity based structure
| Led by: | Dr.-Ing. Stefan Schimmels, Dipl.-Ing. Reinold Schmidt-Koppenhagen, |
| Team: | Dipl.-Hydrol. Anne Tönnies-Lohmann, Dipl.-Ing. (FH) Martin Miranda-Lange |
| Year: | 2012 |
| Remarks: | 6 weeks |
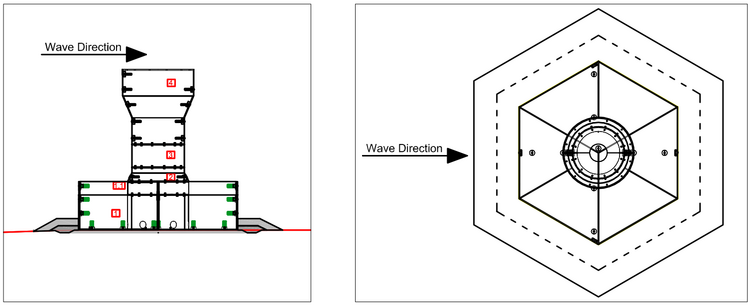
Gravity based structures are widely used to serve as foundation for wind power plants. By the weight of the structure and the ballast material, they are in principle designed to hold the tower and wind turbine in place. The design tested in GWK consists of a main column and a hexagonal base with six caissons for the ballast material. A side view (left) and a top view (right) of the tested model is shown in a rough draft in figure 1. For the design of the structures physical model tests are required to verify the stability of the gravel scour protection layer as well as the size and grading of the ballast material in the cells of the structure.
The structure is tested with a scale of 1:10 for different load conditions varying between events with 10 to 100 year return periods. The given load conditions are all related to a Jonswap spectrum and a repetition period of 1000 statistically independent waves, which corresponds to a design event of 3 hours in prototype scale. Generated significant wave heights range from Hs = 0.42 m to 0.55 m in the flume
During the physical model tests the scour development was documented by measuring the eroded volume relevant for calculating the design damage level. The erosion of material was quantified with a 3-dimensional laser scanner system. In order to make a statement about the scour development after wave attack, the model set-up is scanned twice - before and after an event. This allows to directly compare pre- and post-scan and evaluate the eroded volume of the scouring. Difference plots have been generated for both, the lower and upper part of the model - the scour armor layer and the top ballast of the caisson. Pre- and post-scan are visualized in figure 2. The plots show the motion of the material by accentuating erosion with red color and accumulation with blue color.